


But for many low- and middle-income (LMI) Americans today, this exchange no longer works in their favor. The hours they spend working—often long, unpredictable, and physically demanding—aren’t generating the returns they once promised. As rising costs outpace wages, those hours are barely keeping families afloat. And the little time they do have is consumed by unpaid responsibilities like caregiving, commuting, or managing basic household needs.
In this way, time has become a scarce and unevenly distributed resource that is quietly, but powerfully, shaping economic outcomes. Those with money can buy back their time, outsourcing tasks and freeing themselves to pursue education, professional development, or rest. But those without are caught in a double bind: they must work more to make ends meet, yet the more they work, the less time they can invest in the very things that could help them get ahead.
This growing imbalance raises a pressing question: what does it actually take to afford a life with stability, dignity, and time to grow?
To answer this, the Ludwig Institute for Shared Economic Prosperity (LISEP) developed the Minimal Quality of Life (MQL) Index, which measures the income required to sustain a basic standard of living—one that supports not just survival but well-being, growth, and upward mobility.
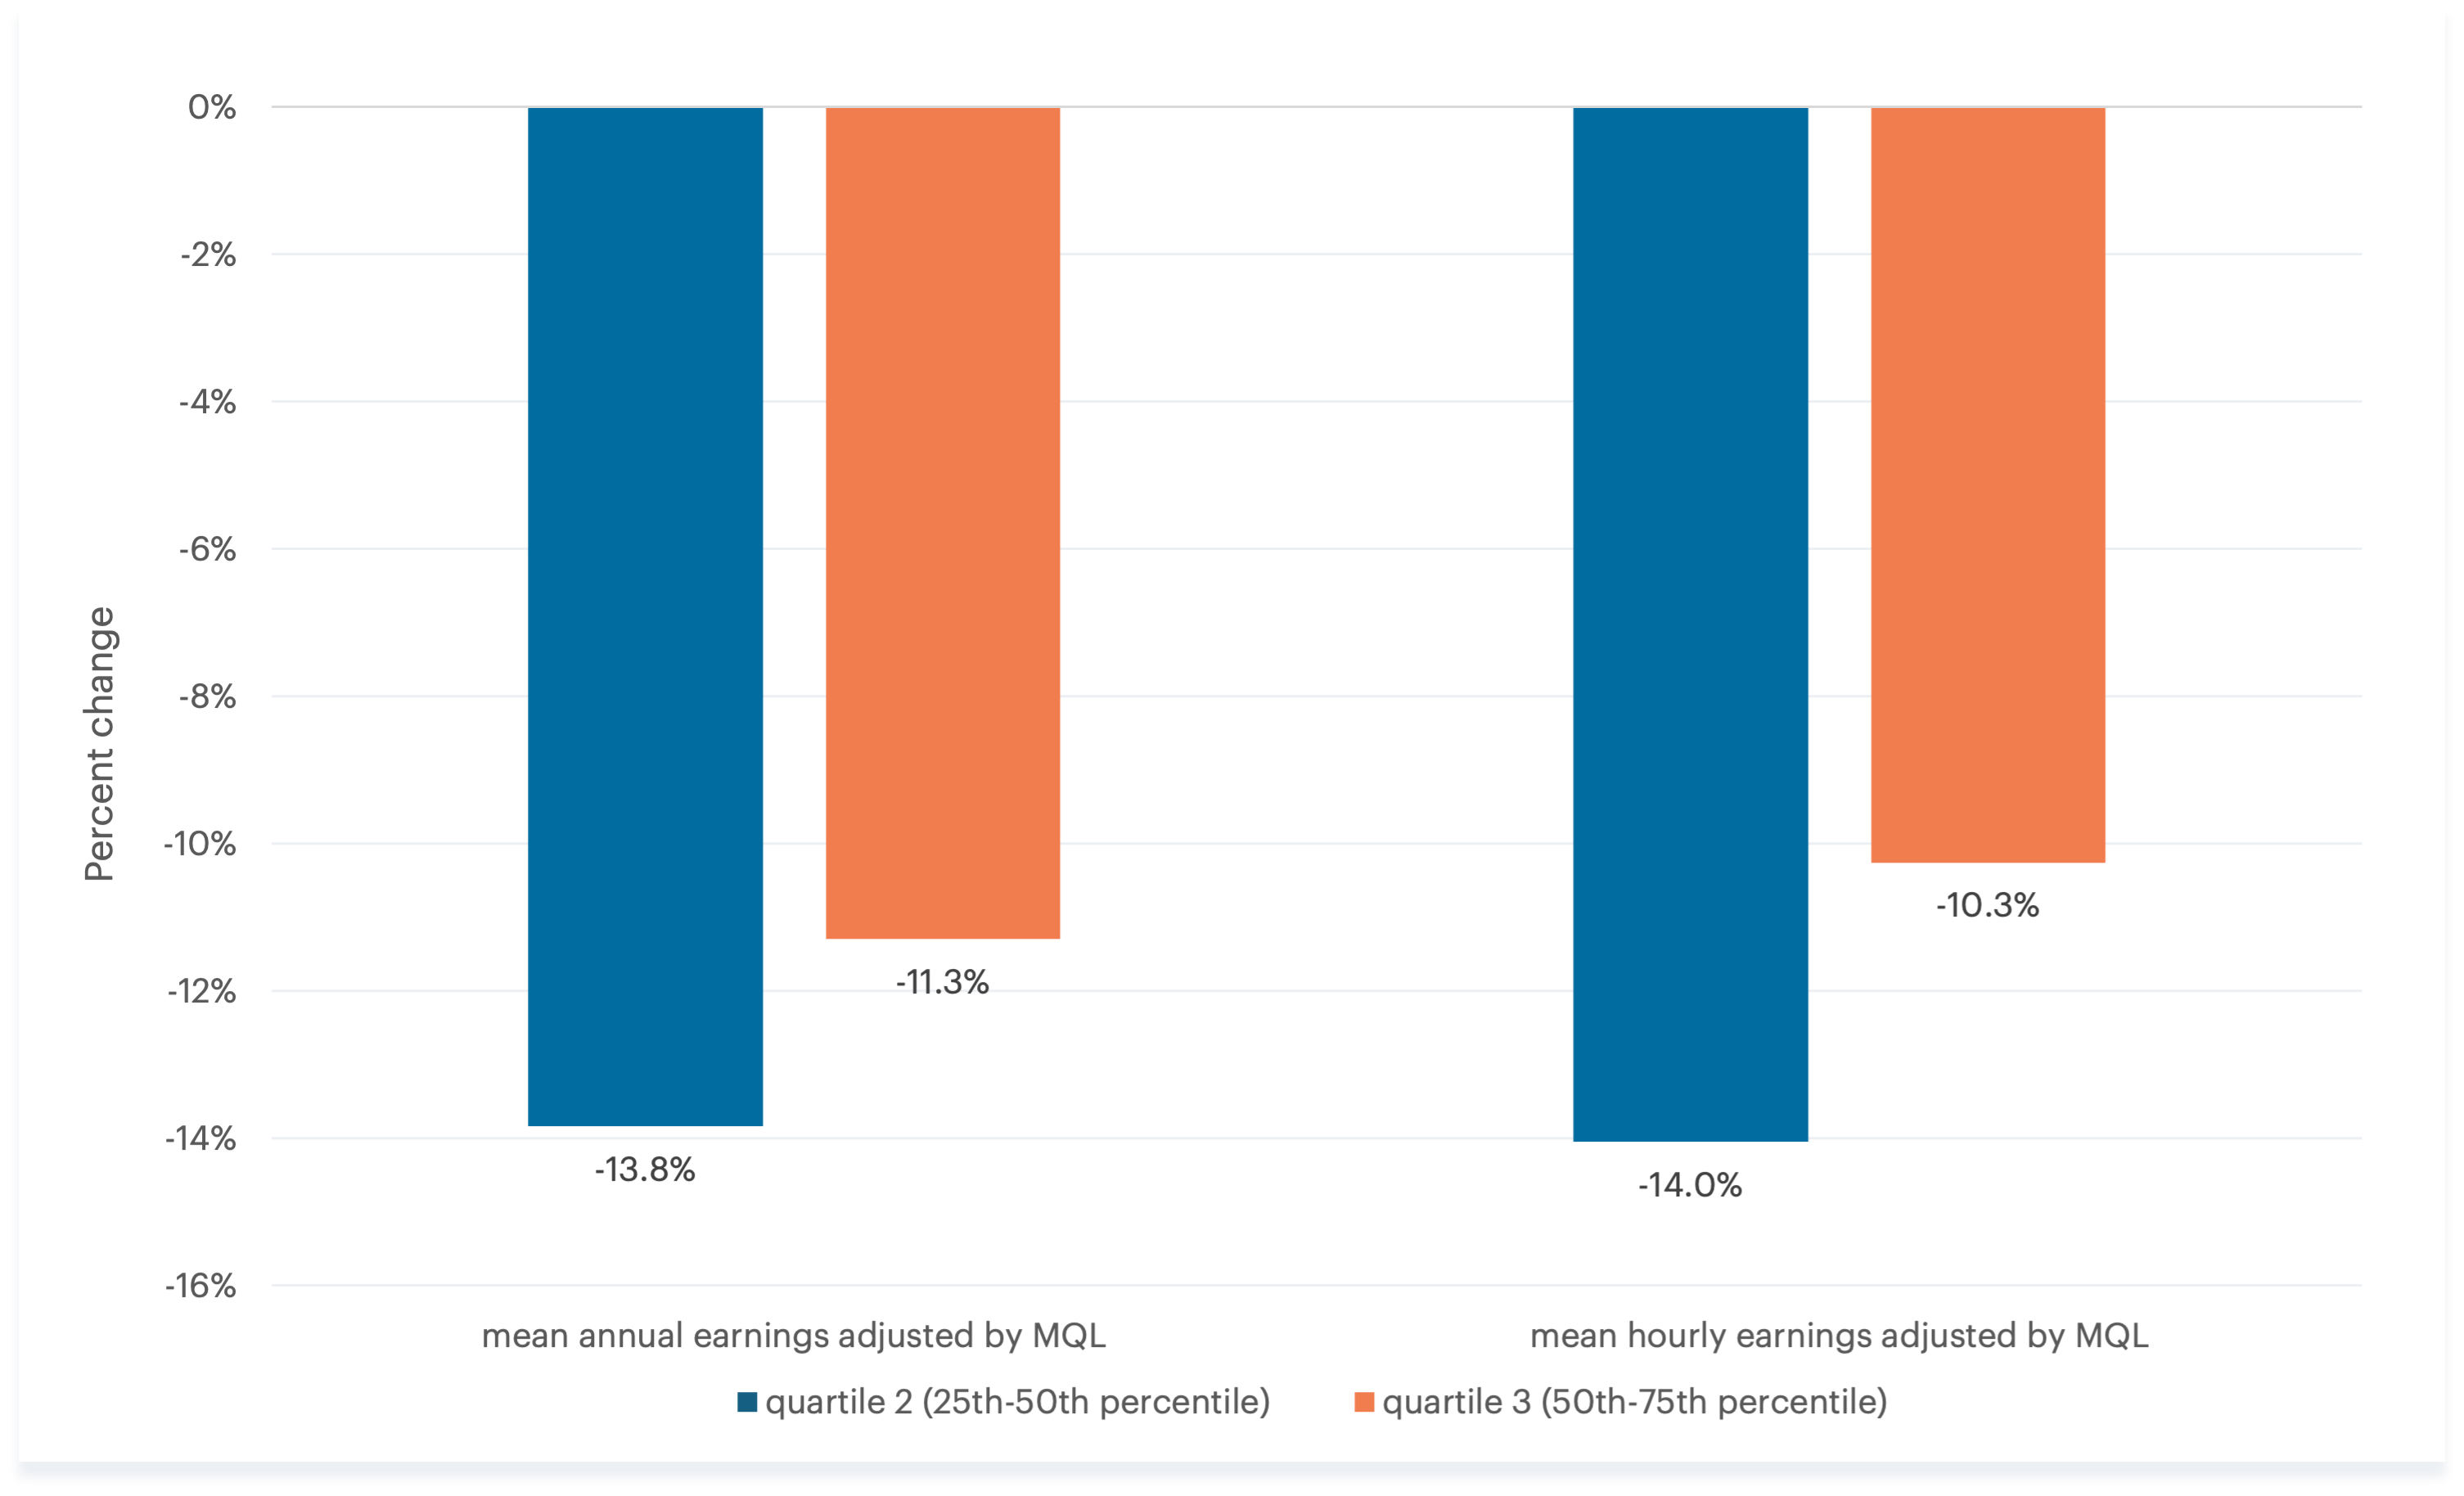
Between 2001 and 2023, the MQL rose by 99.5%. During that same period, wage growth didn’t keep pace: nominal hourly wages rose just 71.4% for prime-age workers in the second earnings quartile and 79% for those in the third quartile. Adjusted for cost-of-living, that means real hourly wages for prime-age workers fell by 14% and 10.3% respectively.1 As a result, workers in both groups had to spend more time working just to keep up and still fell behind. Even as annual work hours rose by 26 and 12 hours to 2,075 and 2,202 hours respectively,2 their purchasing power in MQL terms dropped by 13.8% and 11.3%. Their annual incomes—$41,600 and $67,100—fell far short of the cost of a minimal quality of life.3
When wages fall short, the cost of meeting basic needs rises in both dollars and hours. The MQL attempts to account for this by including key expenses that help mitigate time poverty, such as childcare, transportation, and food-away-from-home. But inflation in these categories has hit time-poor households hardest.
Consider transportation. For many LMI workers, owning a car is a prerequisite for accessing jobs, shortening commutes, and avoiding time poverty. Housing generally becomes more affordable the farther it is from job centers and transportation hubs, making car ownership essential for reaching opportunities in a reasonable amount of time. Public transit users face a significant time penalty: On average, they spend 49.7 minutes to get to work, twice the time of those who drive.4 For year-round workers, that one-way disparity amounts to 100 additional hours of travel annually.5 Late-shift workers, for example, endure commutes twice as long on public transit if they don’t have access to a car.6 And the number of workers with commutes exceeding 90 minutes has surged by over 4 million in recent years, especially in expensive metros such as San Francisco or Seattle.7
Although daily transportation costs rose by 55% between 2001 and 2023 (nearly half as much as the MQL), car ownership remains costly, averaging around $11,000 annually. Households in the second- and third income quintiles with vehicles spent a fifth of their after-tax income on transportation, four times more than those relying on other modes.8
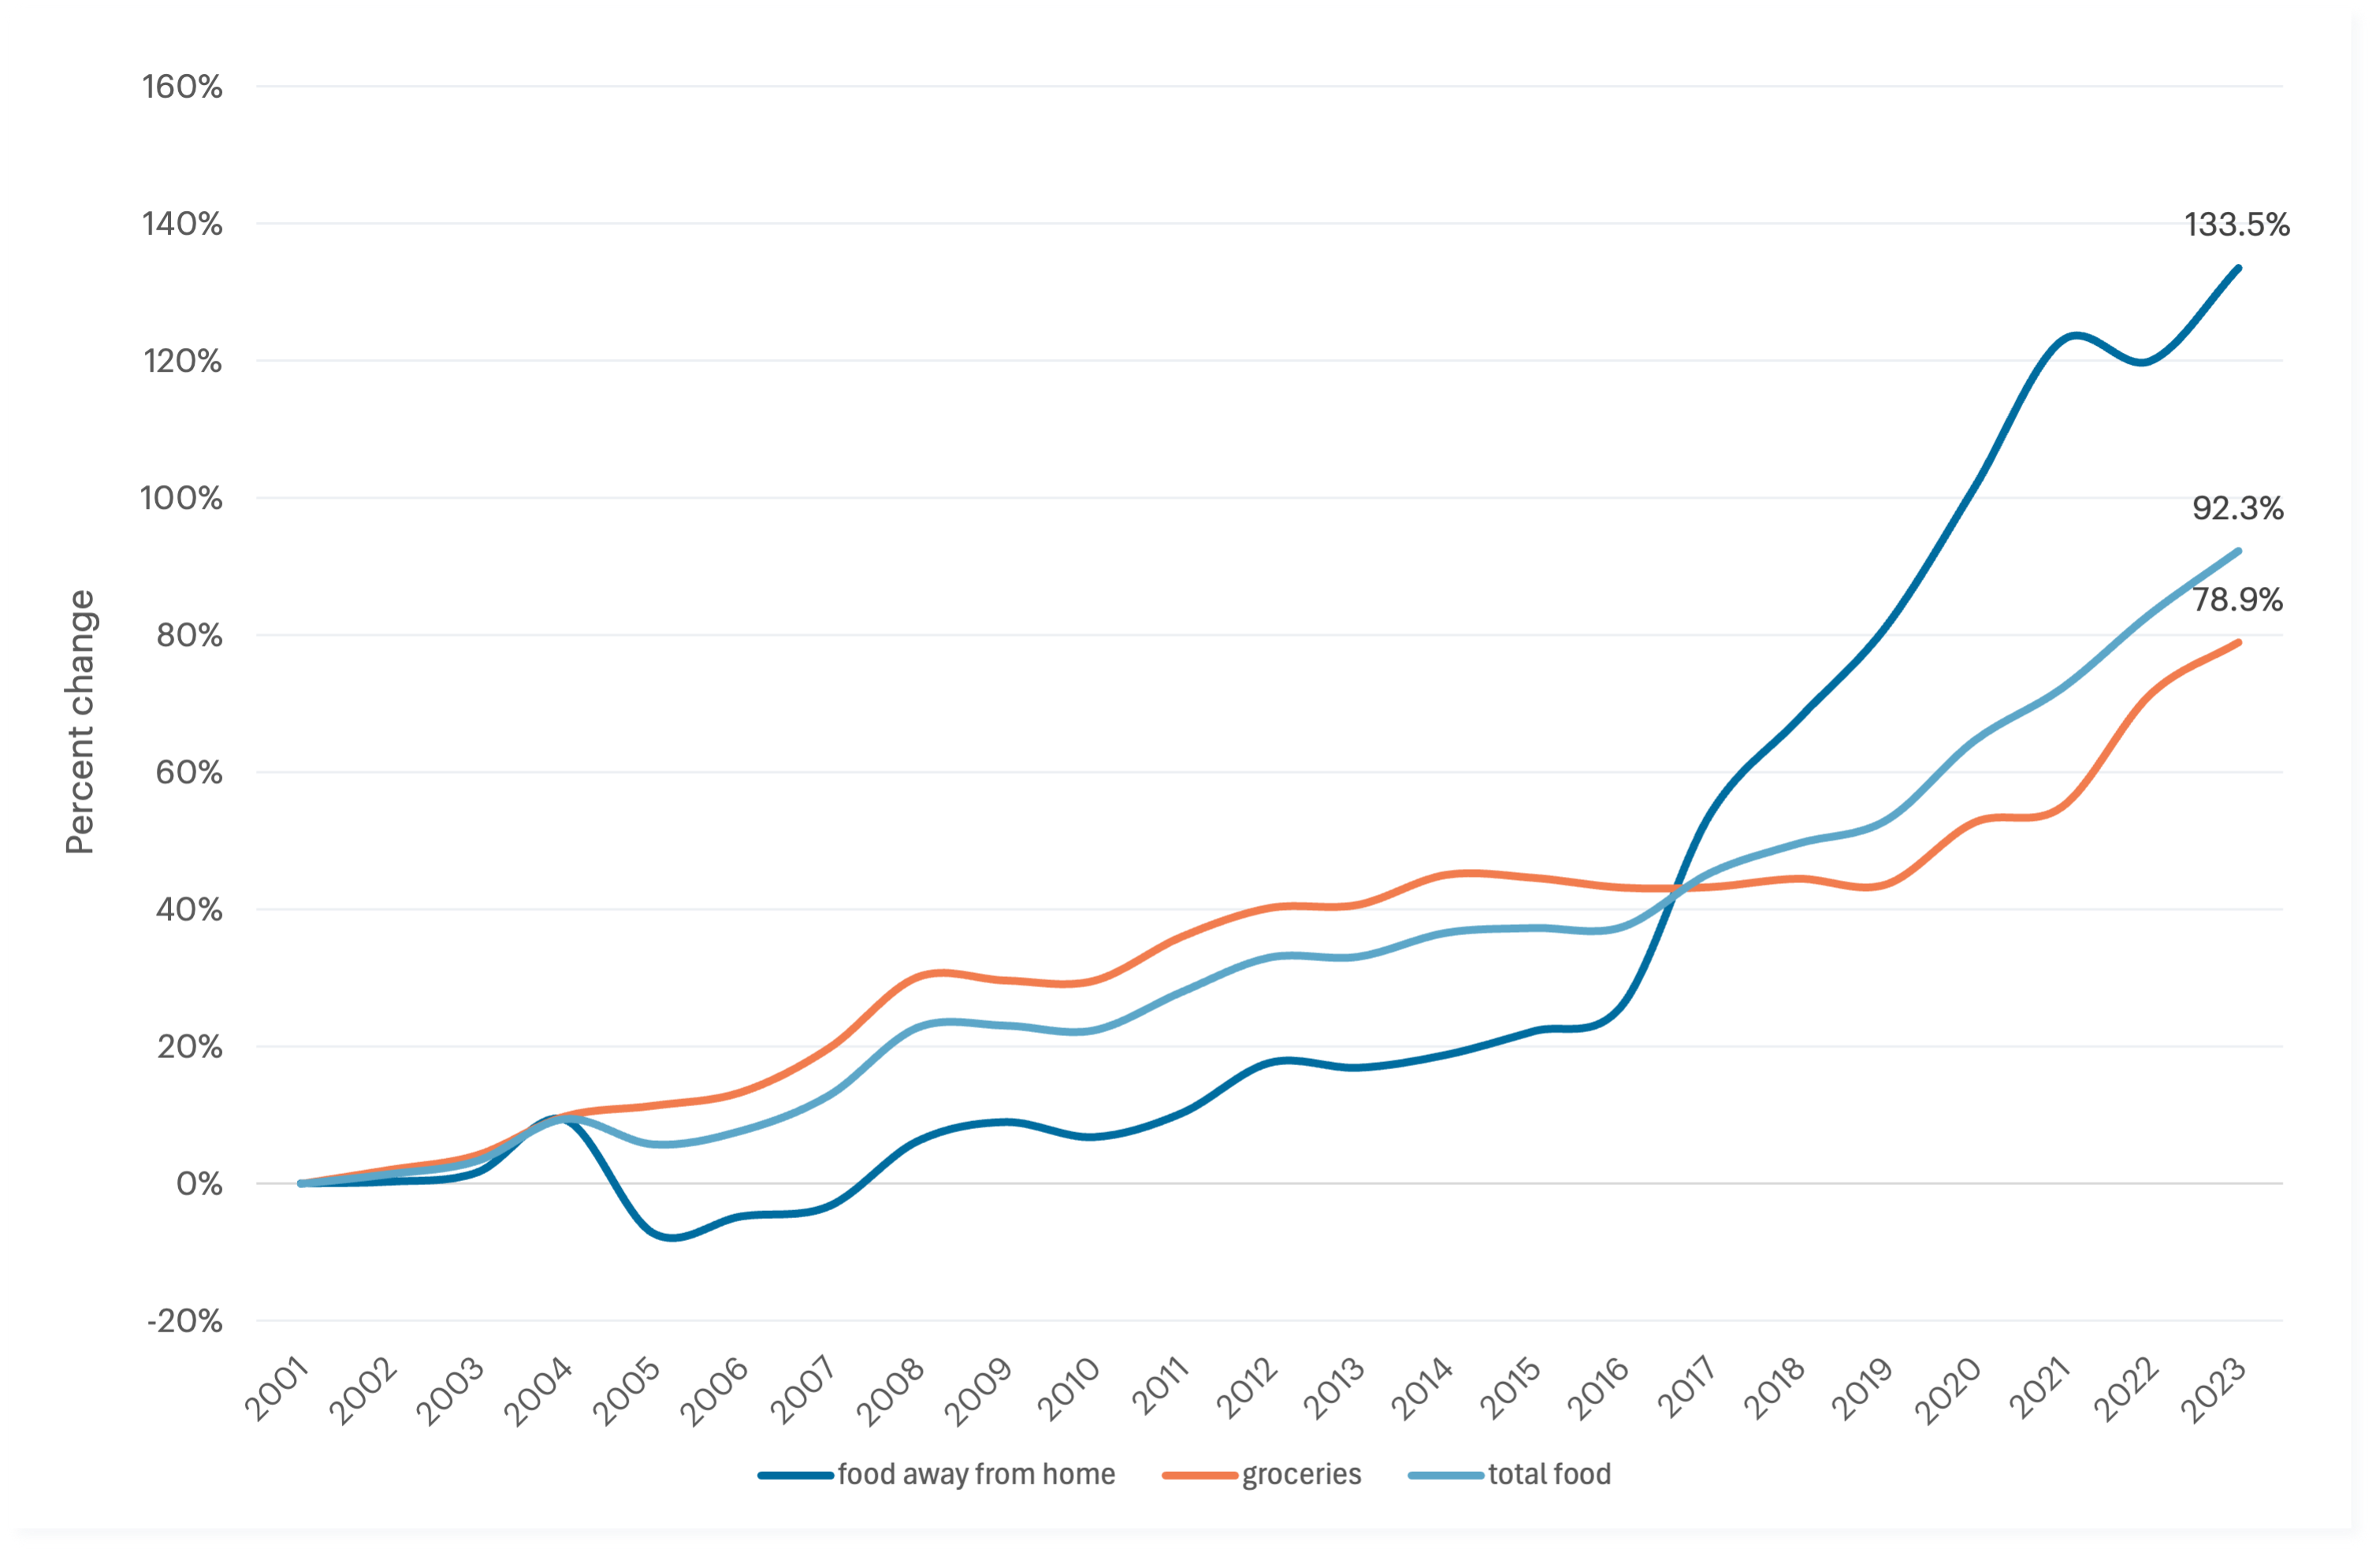
Similarly, food-away-from-home costs have risen 1.7 times faster than groceries since 2001. Time-pressured households rely more on convenience food, such as ready-to-eat meals, takeout, and snacks. Compared to high-income households, low- and middle-income households spend more of their food budget on fast-food restaurants whose prices have increased considerably.9 Between 2014 and 2023, fast food prices jumped by 46.8%, outpacing the 28.7% rise tracked by the Consumer Price Index basket,10 and this trend has persisted in 2024.11 For time-poor households, the trade-off between convenience and health becomes yet another cost of economic insecurity.12
If working- and middle-class households could easily afford a minimal quality of life, time scarcity would be less problematic. What makes it so corrosive is that it forces continuous, high-stakes trade-offs between financial survival and personal well-being. Unlike high-income professionals—like lawyers or financial analysts—who often see long-term returns on their time investments, LMI workers rarely do. Holding multiple jobs or enduring long commutes might be justifiable if they paved the way to upward mobility. But more often, this isn’t the case.13
Education is the most salient example. While it remains a crucial pathway to better-paying work, the time and money required to pursue it are increasingly out of reach. Between 2001 and 2023, the cost of a four-year public university degree rose by 122%, to about $95,000.14 Without significant financial aid, many LMI students must work full-time while studying—hindering their academic performance and delaying graduation. Others may choose shorter programs, like certificates or associate’s degrees, which offer quicker completion but lower long-term earnings.15 Some forego furthering their education at all given the high cost of attendance.
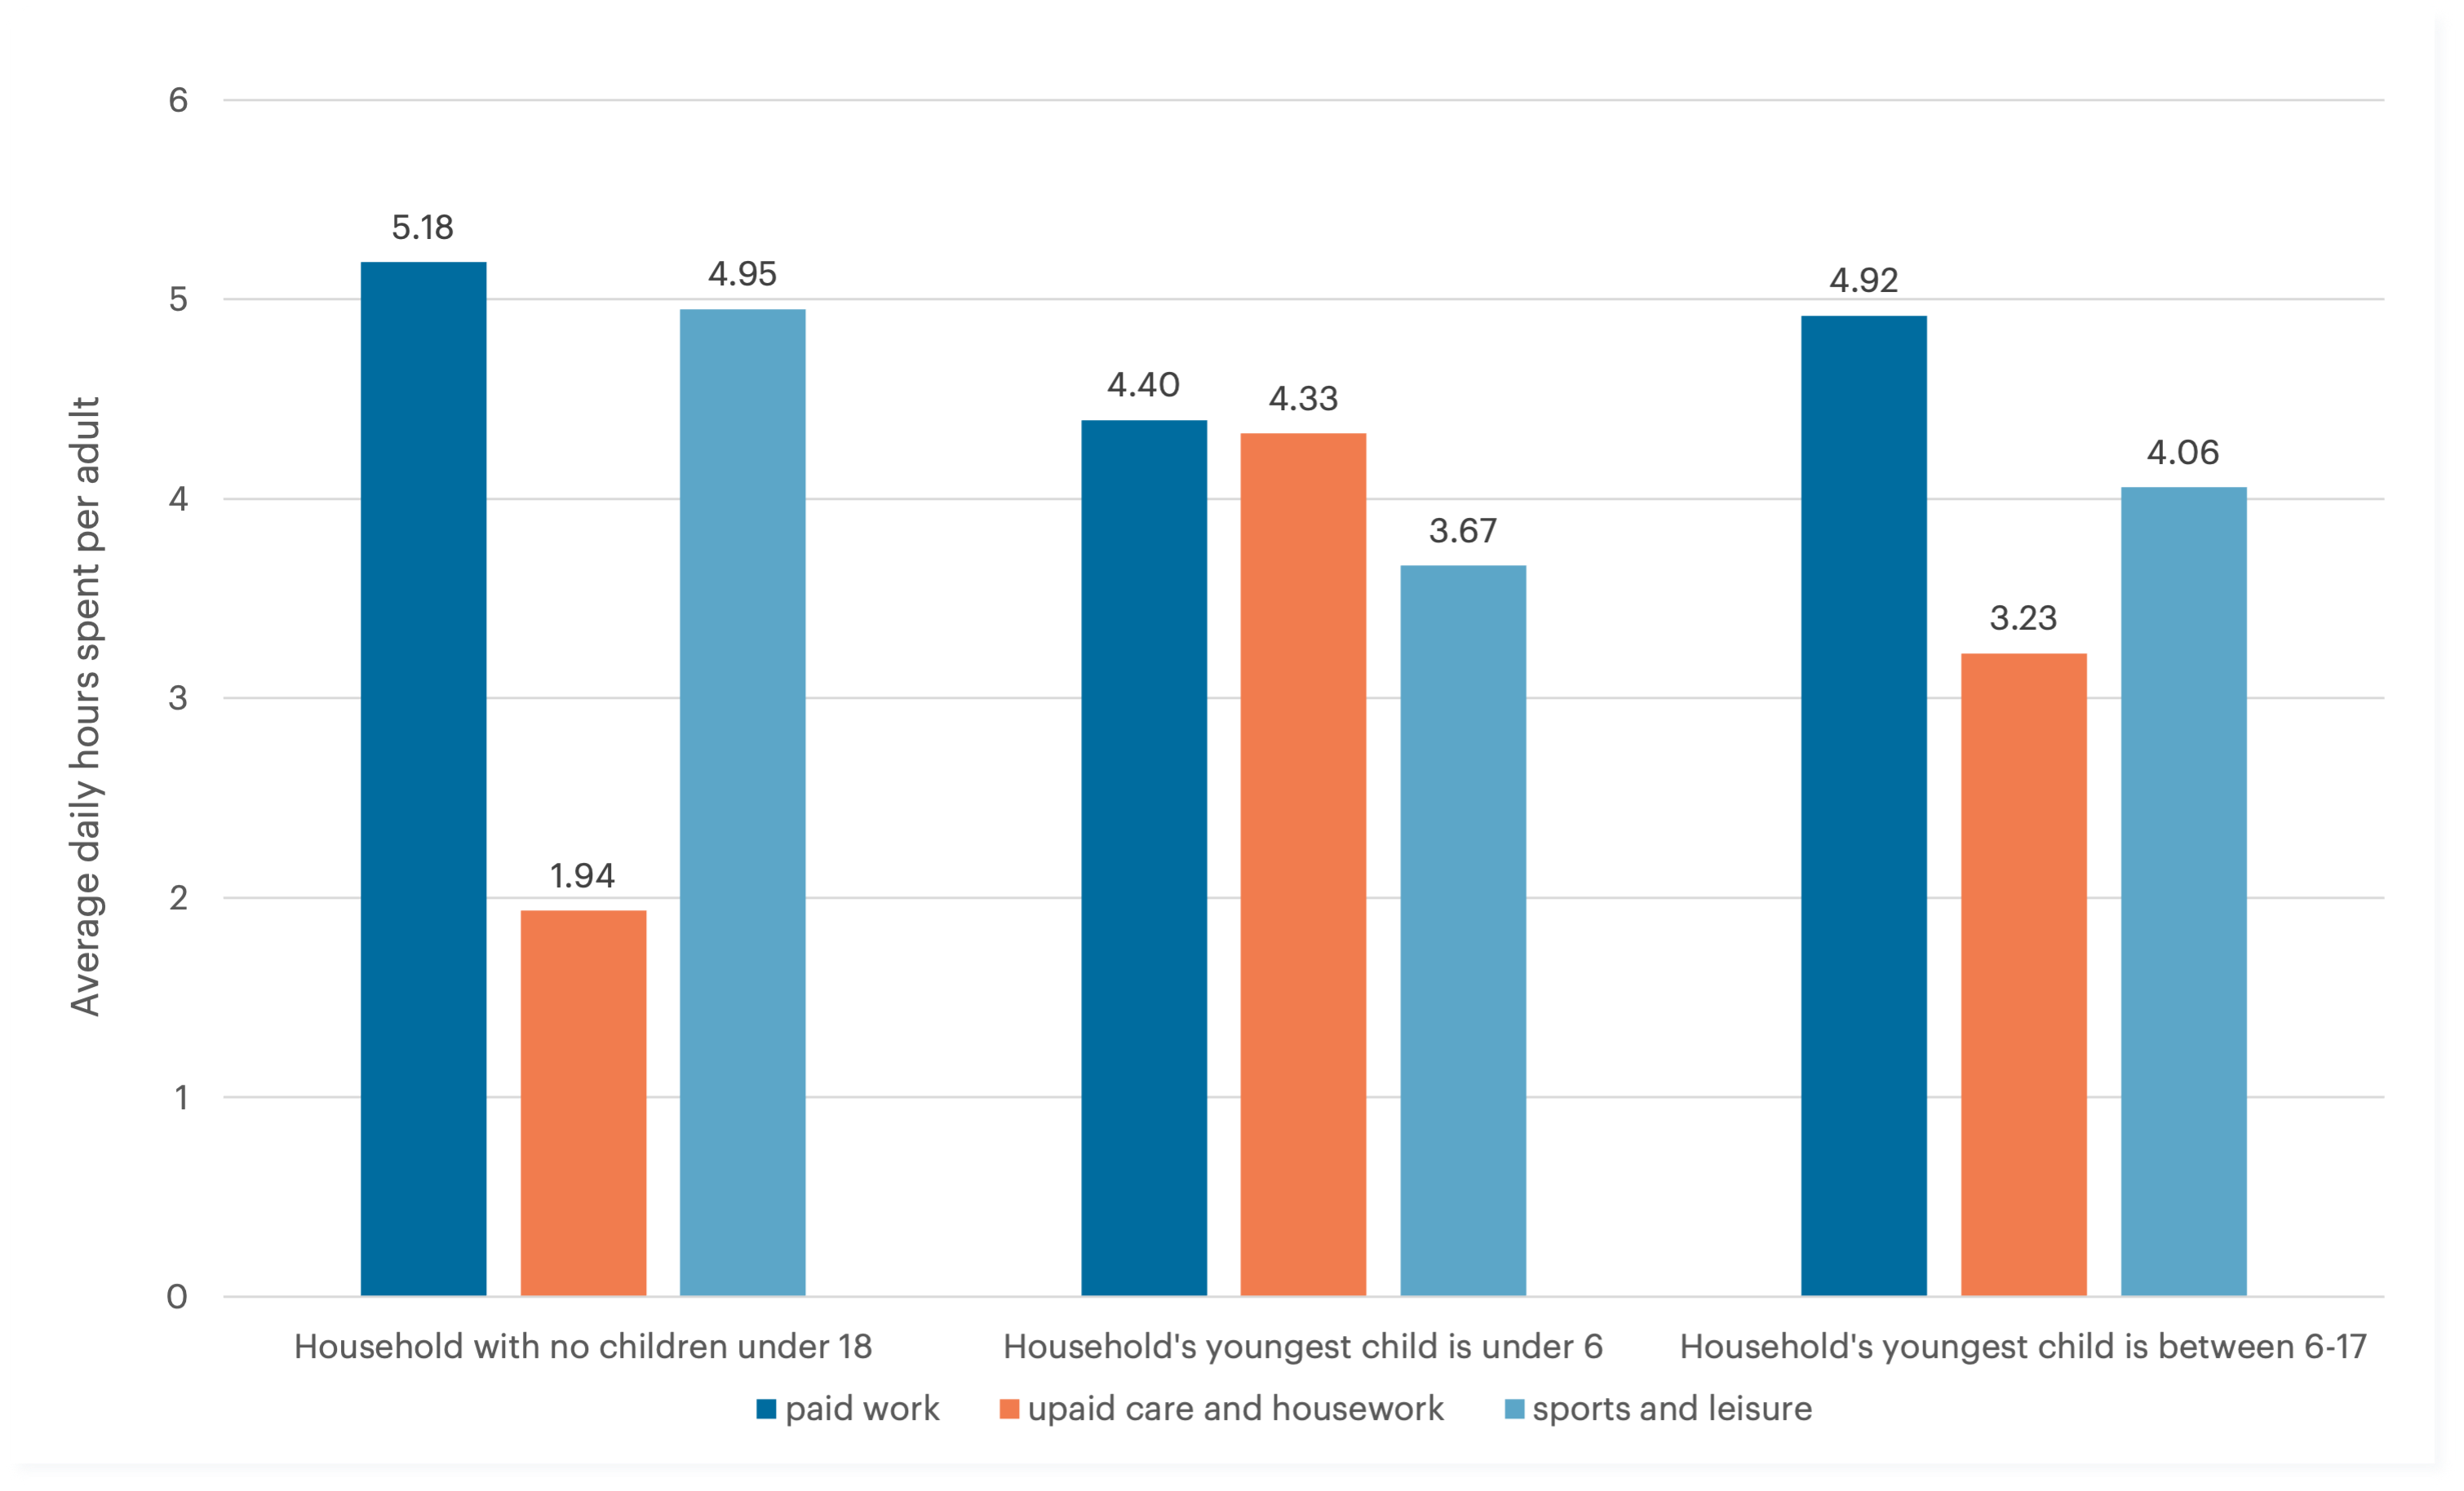
Parents with young children, especially mothers, face an even more intense time squeeze. In 2023, the average cost of full-time childcare approached $12,000 per child, leading many parents to reduce work hours or leave the labor force altogether. The result is a persistent “motherhood penalty”— a 4% drop in earnings per child due to career interruptions or the need for flexible, low-paying jobs.16, 17 Unsurprisingly, parents experience significantly higher levels of time pressure, unpaid labor, and financial stress.18, 19, 20
The squeeze on both income and time also carries long-term health consequences. LMI workers under time pressure often exercise less, eat lower-quality diets, and lack access to restorative resources.22 Adults in households earning 200% above the poverty line are twice as likely to meet federal physical activity guidelines as those below it.23 Meanwhile, life expectancy for adults without a college degree has declined since 2010 and now trails that of college graduates by eight years.24 Rates of psychological distress are also markedly higher among lower-income Americans, who face elevated levels of anxiety, hopelessness, and depression.25
Time scarcity and the high cost to affording a Minimal Quality of Life combine to make achieving both well-being and financial security exceptionally difficult for full-time working households. It forces LMI adults to make sacrifices trading off economic opportunity, health and quality time, steepening the climb for upward mobility. Efforts to improve the well-being of working- and middle-class households should aim to reduce both financial and discretionary time barriers to have lasting impact and a real opportunity to fulfill the American dream. In short, time scarcity and economic insecurity are deeply intertwined. Together, they make it extraordinarily difficult for full-time workers to achieve financial stability, personal well-being, and upward mobility. For millions of LMI Americans, every day involves hard choices: between earning a paycheck or caring for a child; between saving for the future or getting through the week. While the MQL incorporates some of these pressures—through childcare, transportation, and food away from home costs—it still cannot fully capture the hidden toll of time poverty.
Any serious effort to improve economic well-being must address not only income inequality but also the unequal distribution of time and opportunity. A decent life shouldn’t require constant trade-offs between money and self-preservation. Until workers are given both the time and the resources to invest in themselves and their families, the American dream will remain out of reach for too many.
To delve deeper into these calculations, explore our methodology.

